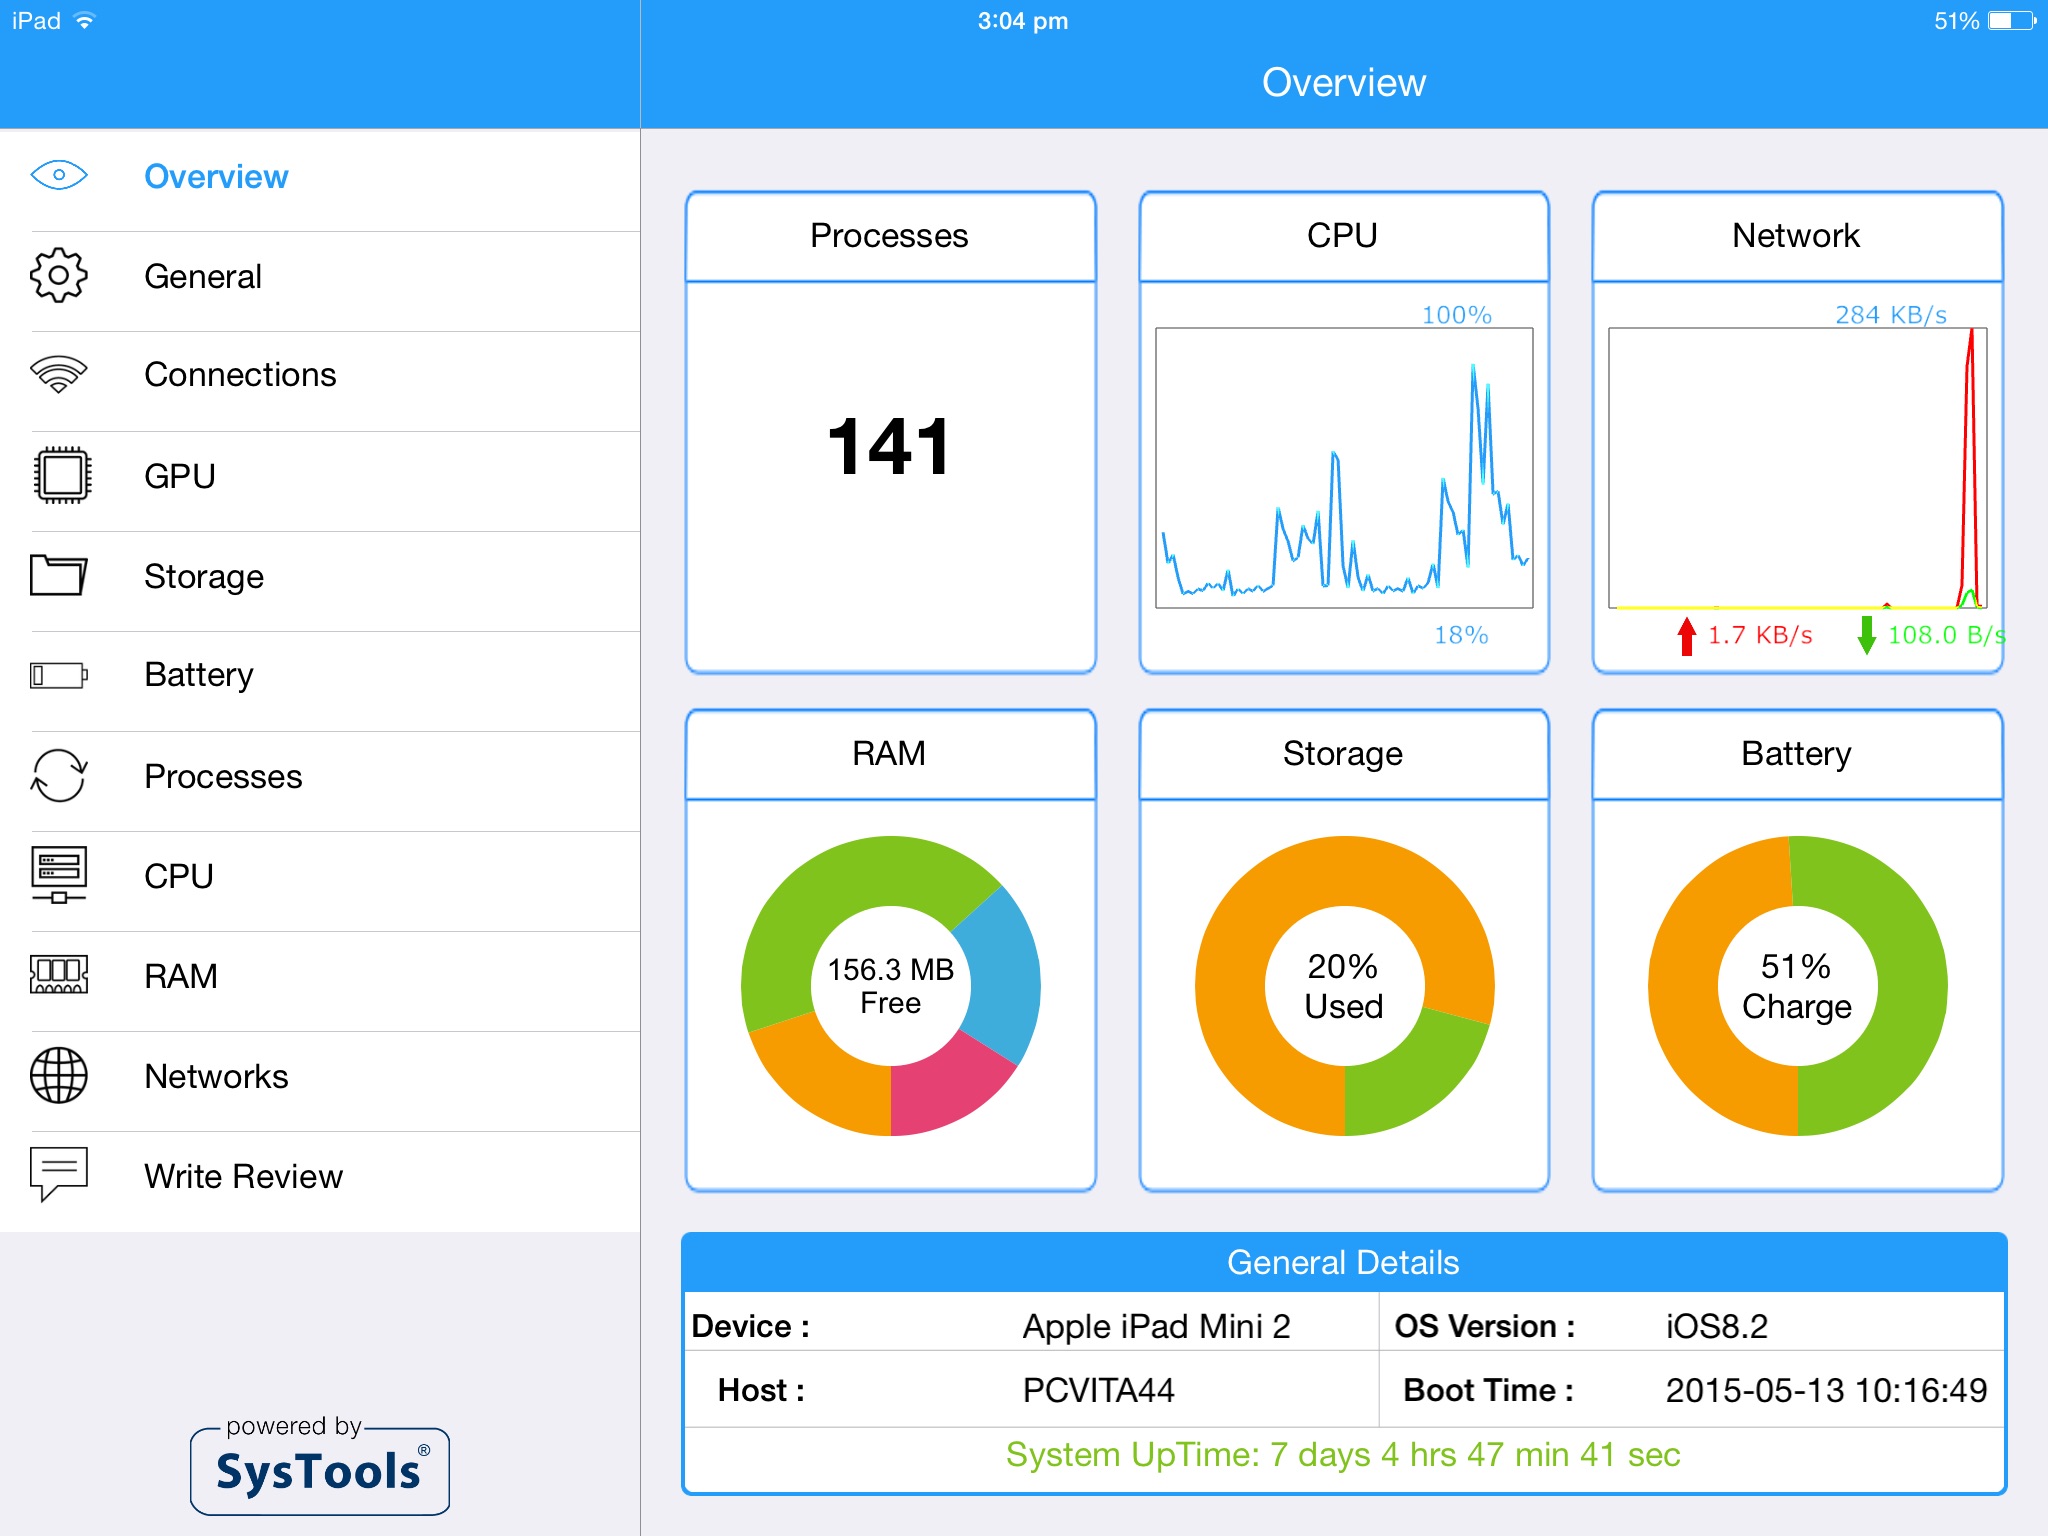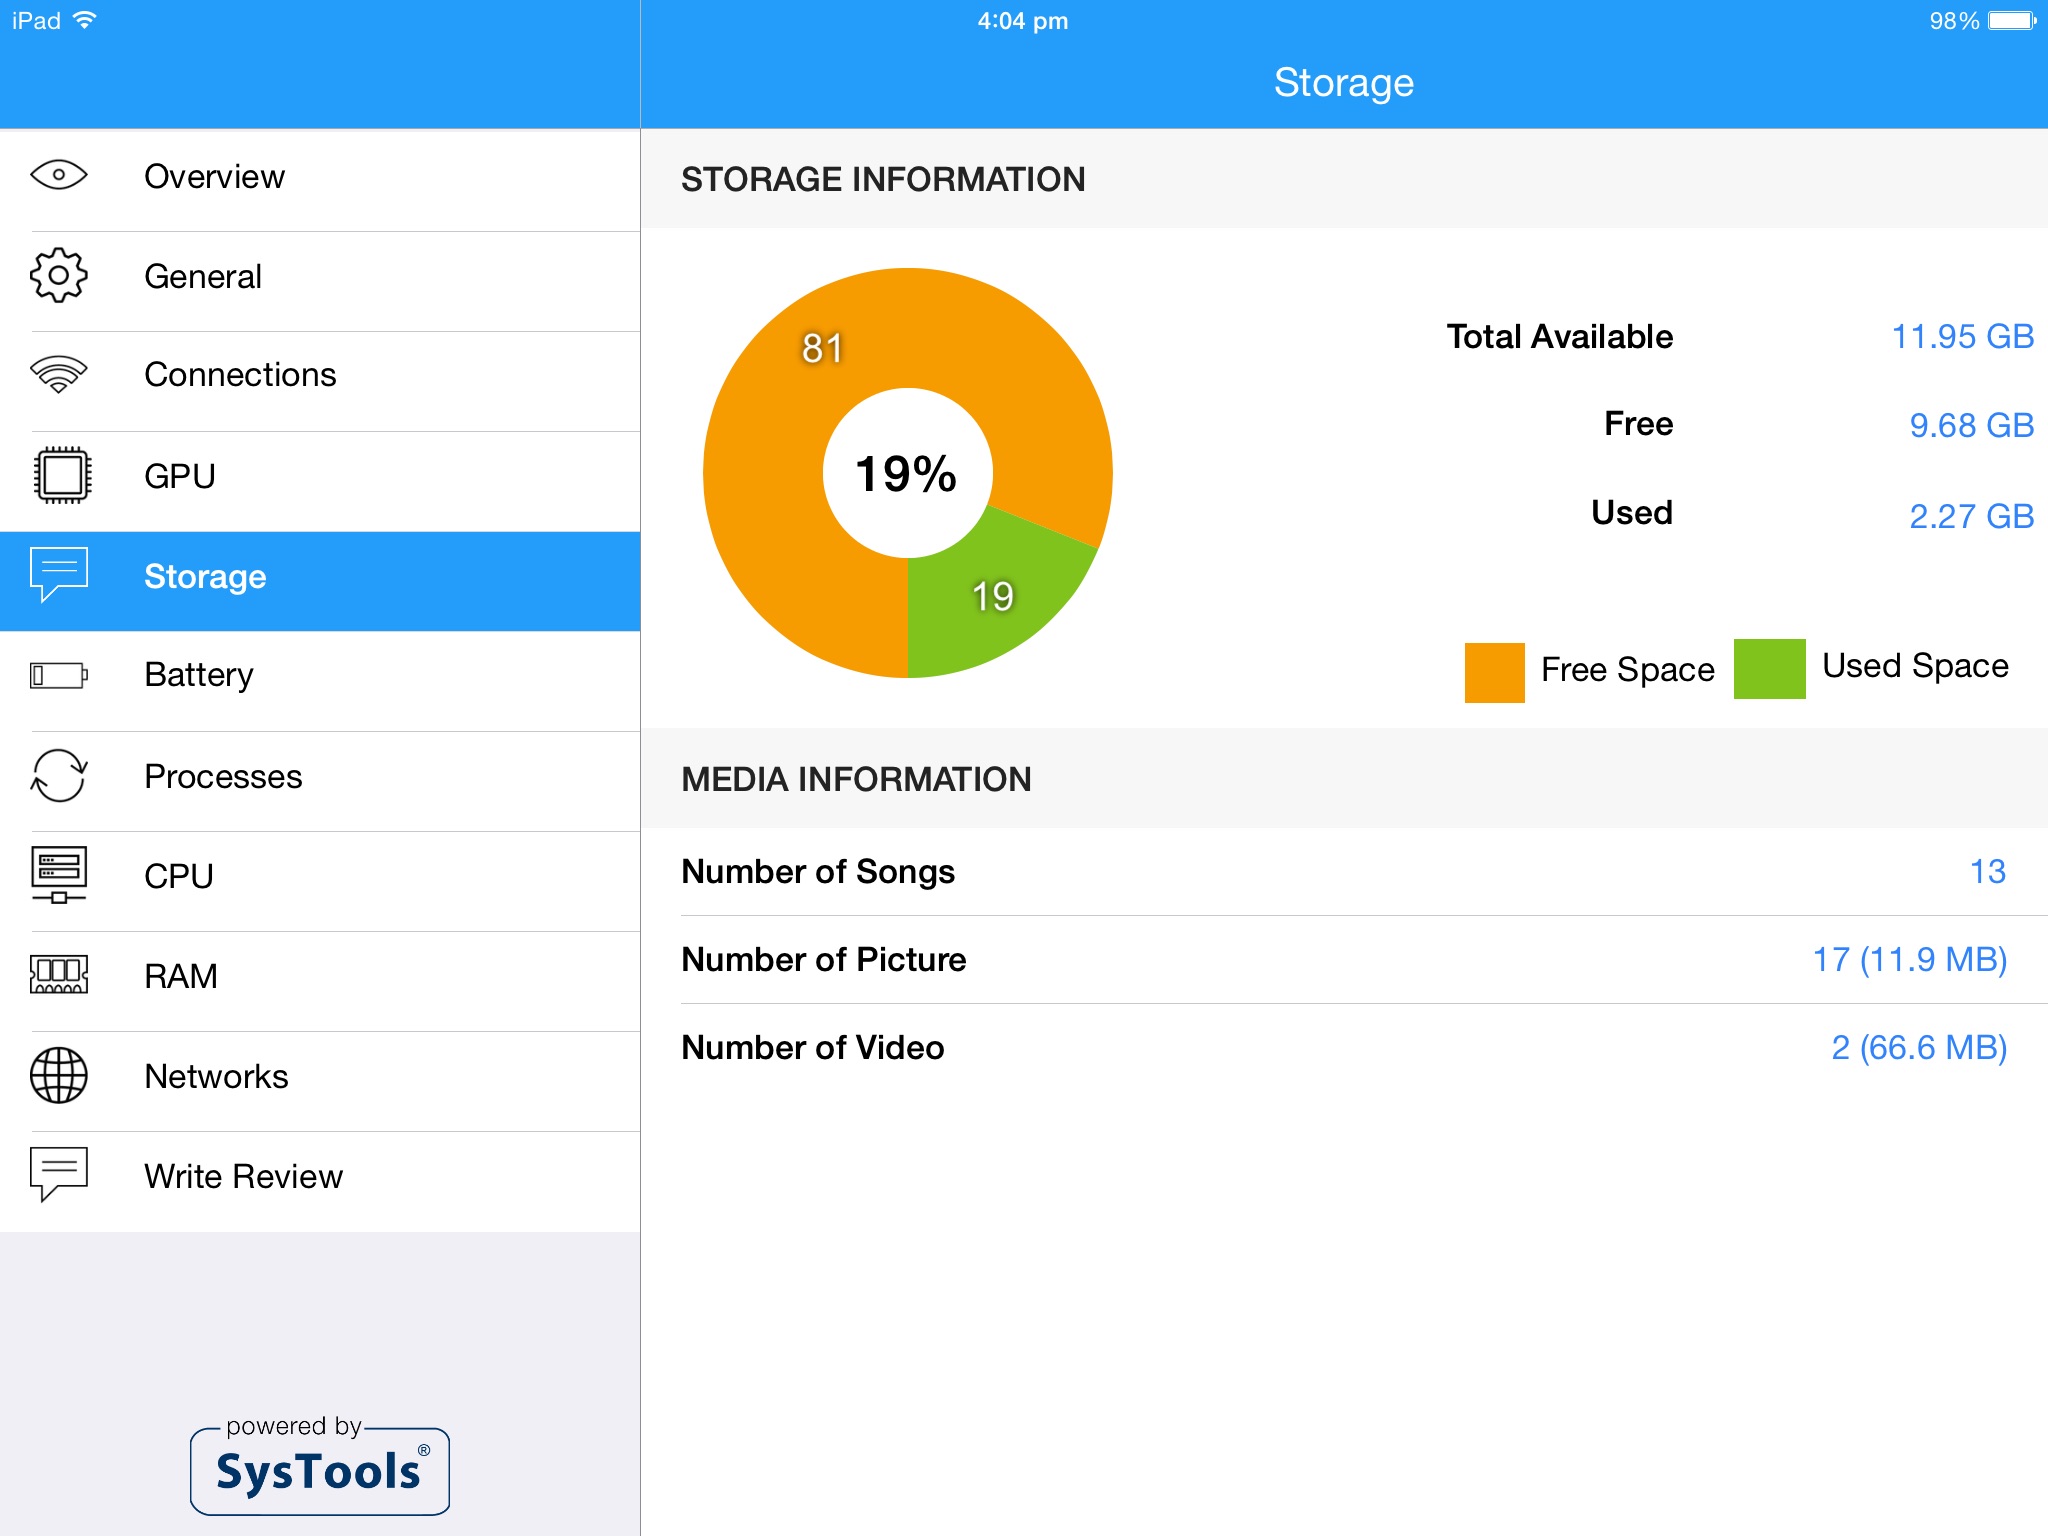
SYSTEM PROFILER dashboard provides a well-organized, multi-layered user interface using which information about the iPad applications, Operating System, and active services can be checked.
System: This tab will give information about currently running devices, the amount of CPU and battery usage, space utilization, page memory allocation, technical specification related to product can be found here.
- Device systems information (Name, Version, Retina)
- Uptime, last boot
- Real-time disk usage & free space
- Battery level & status (charging, discharging)
- CPU usage, CPU count, load averages
- Memory usage, pages ins/outs (detailed information)
- All Processes
Memory: Get complete display regarding the RAM specific wired memory, free space, Active, Inactive memory.
- Real time Wired, Active, Inactive memory visual status displays
Network: Type of channel used for carrying information, the type of data employed, bandwidth of the network. Get details about the Internet Protocol ID of the working system (like Subnet Mask, Network Address, Broadcast Address, Host Address etc.).
- Mobile carrier information
- Data Used
- Live network speed
- Advanced information about your network and IP
- Get your public IP (as seen on internet)
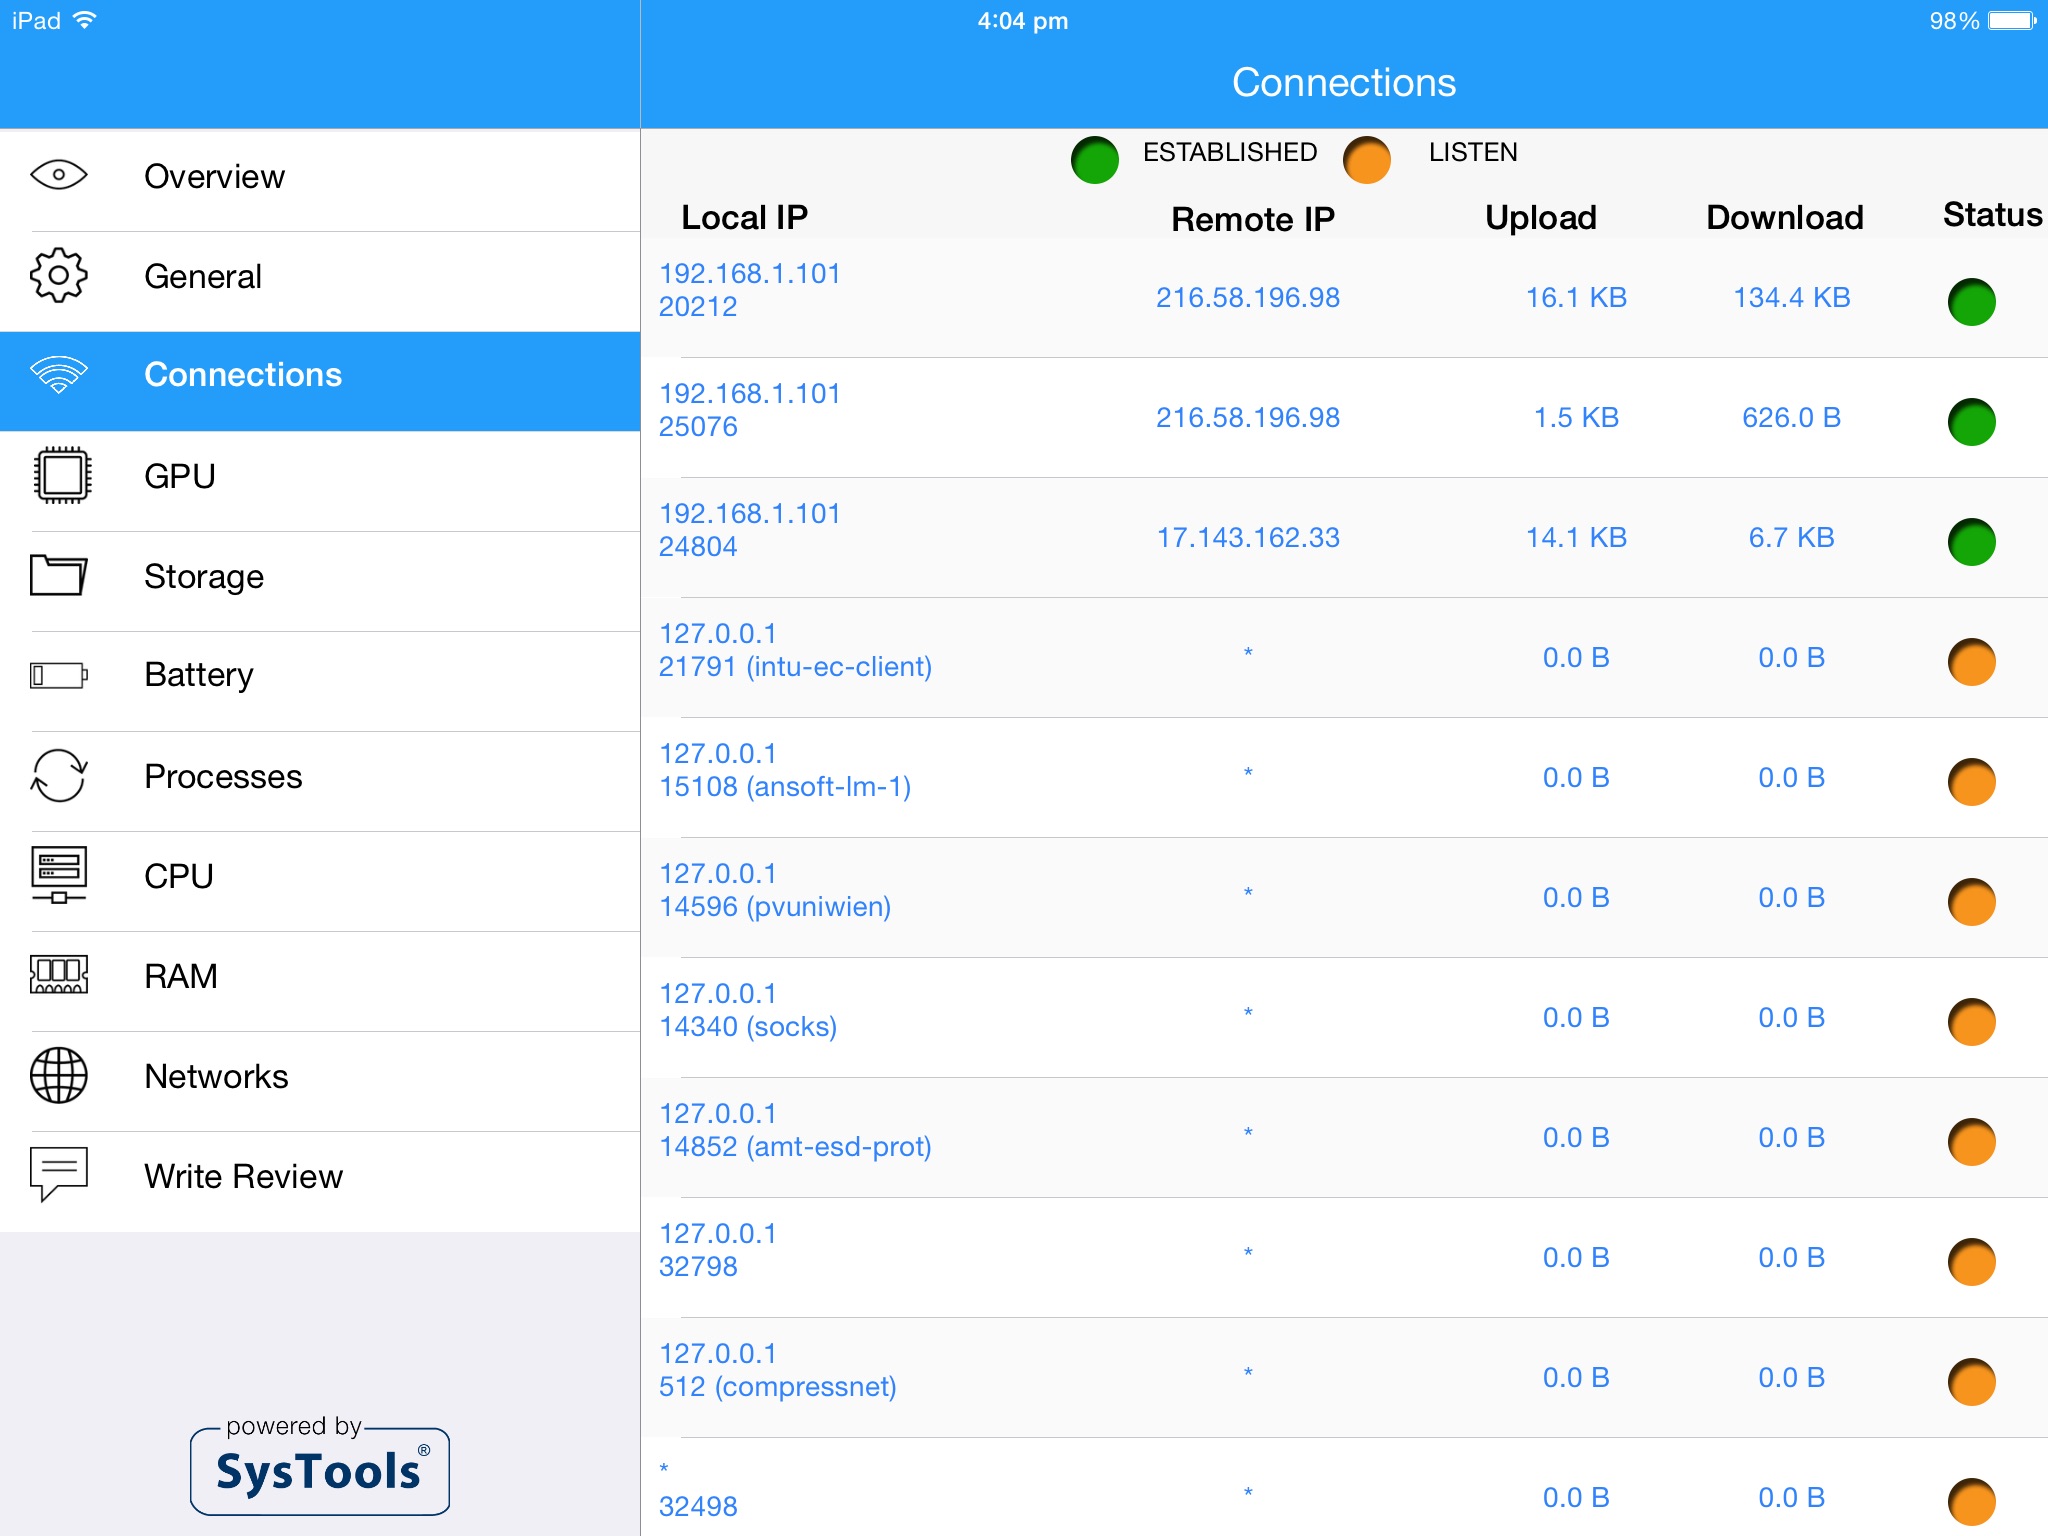
Connections: Get details regarding the number of active connections, remote system IP, local IP with their port numbers.
- List active connections
- Connection local and remote IP
- Connection local and remote port
- Connection status
- Connection download and upload traffic.


